Complex plane plots in Makie
Figures on the other pages of this documentation are made using the Plots package.
Makie required
The examples on this page require using one of the backends for Makie.
The plots below are made in CairoMakie using these defaults:
using CairoMakie
update_theme!(linewidth=3, Axis=(aspect=DataAspect(),));
Point-based plots for complex vectors
A vector of complex-typed values will be interpreted as specifying points using the real and imaginary parts.
using ComplexRegions
z = [complex(cospi(t), 0.4sinpi(t)) for t in (0:400)/200]
fig, ax, _ = lines(z)
scatter!(ax, 1 ./ z; markersize=5, color=:black)
fig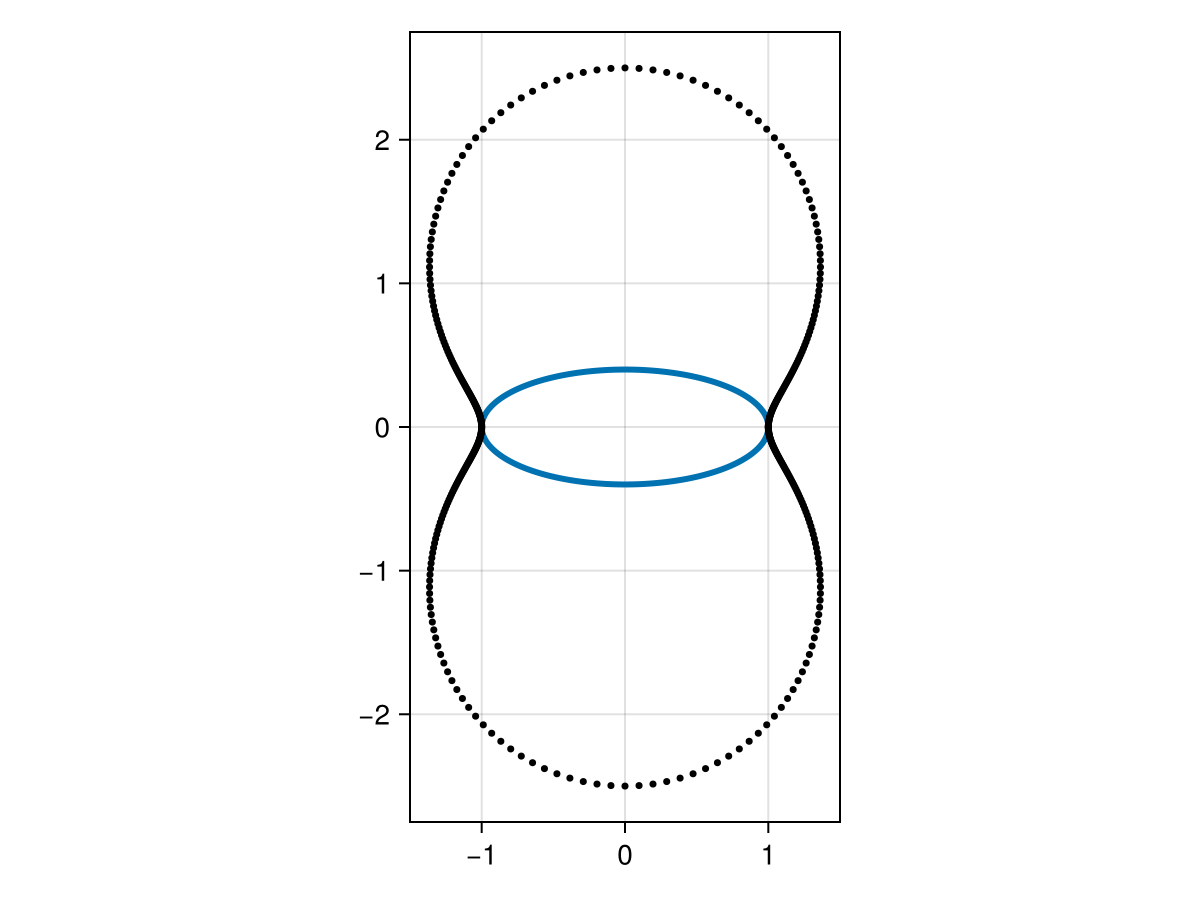
Curves and paths
Because Makie has its own definitions for Circle and Arc, you must either full qualify these names or define unqualified versions like so:
const Circle = ComplexRegions.Circle;
const Arc = ComplexRegions.Arc;fig, ax, cir = plot(Circle(-1, 1))
lines!(Segment(-1-1im, -1+1im))
scatter!(Arc(-1, 1im, 1), color=:darkred)
fig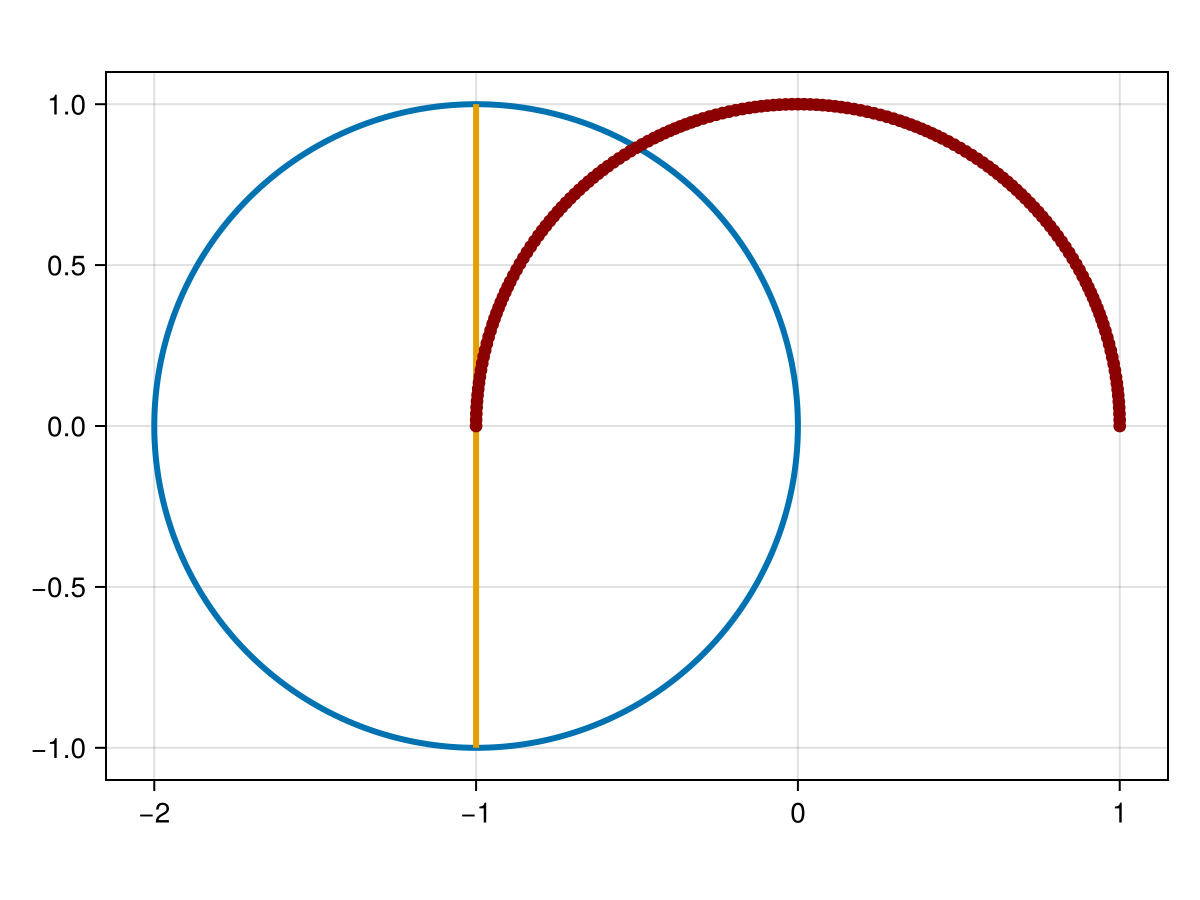
You can also create and plot polygons or other paths.
L = Polygon([0, 1im, -1+1im, -1-1im, 1-1im, 1])
plot(L)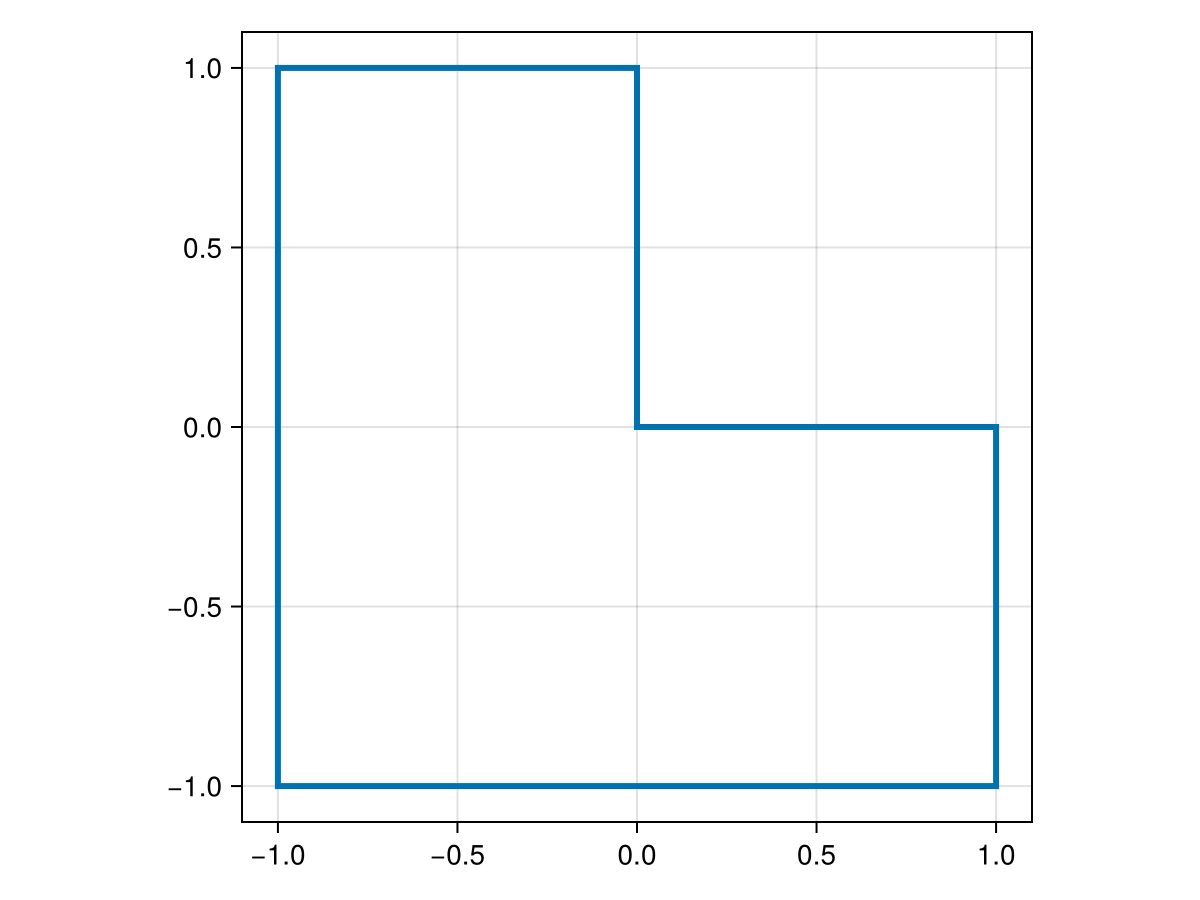
There are some predefined paths in the Shapes submodule.
fig, ax, _ = lines(Shapes.ellipse(1, 0.5))
lines!.(ax, [
    2im + Shapes.star,
    -2im + Shapes.cross,
    2 + Shapes.triangle,
    -2 + 0.3im*Shapes.hypo(3)
    ])
fig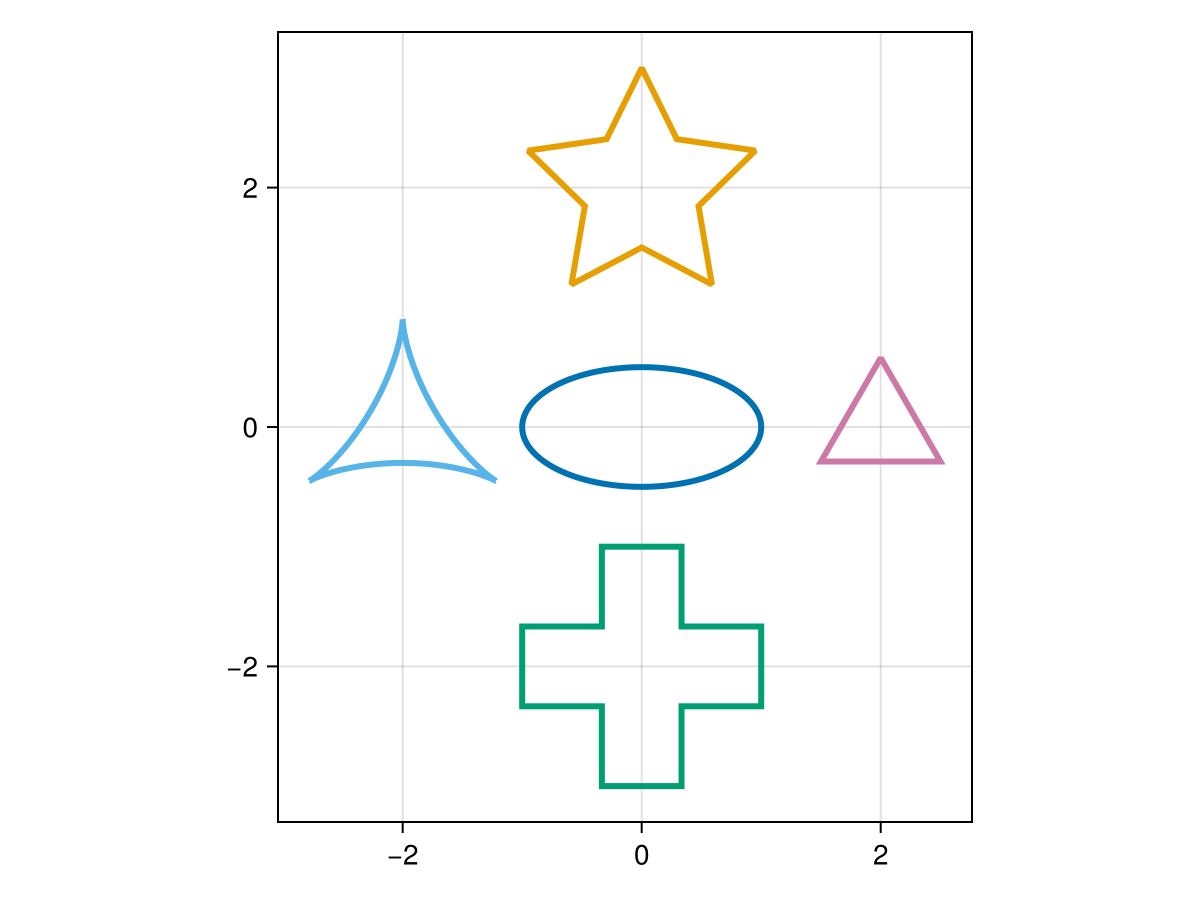
The plotdata function is responsible for generating points adaptively to make a nice plot. You can also select a discretization yourself by just evaluating the curve at fixed parameter values.
S = Shapes.spiral(1, 1.2)
scatter(S(range(0, 4, 300)))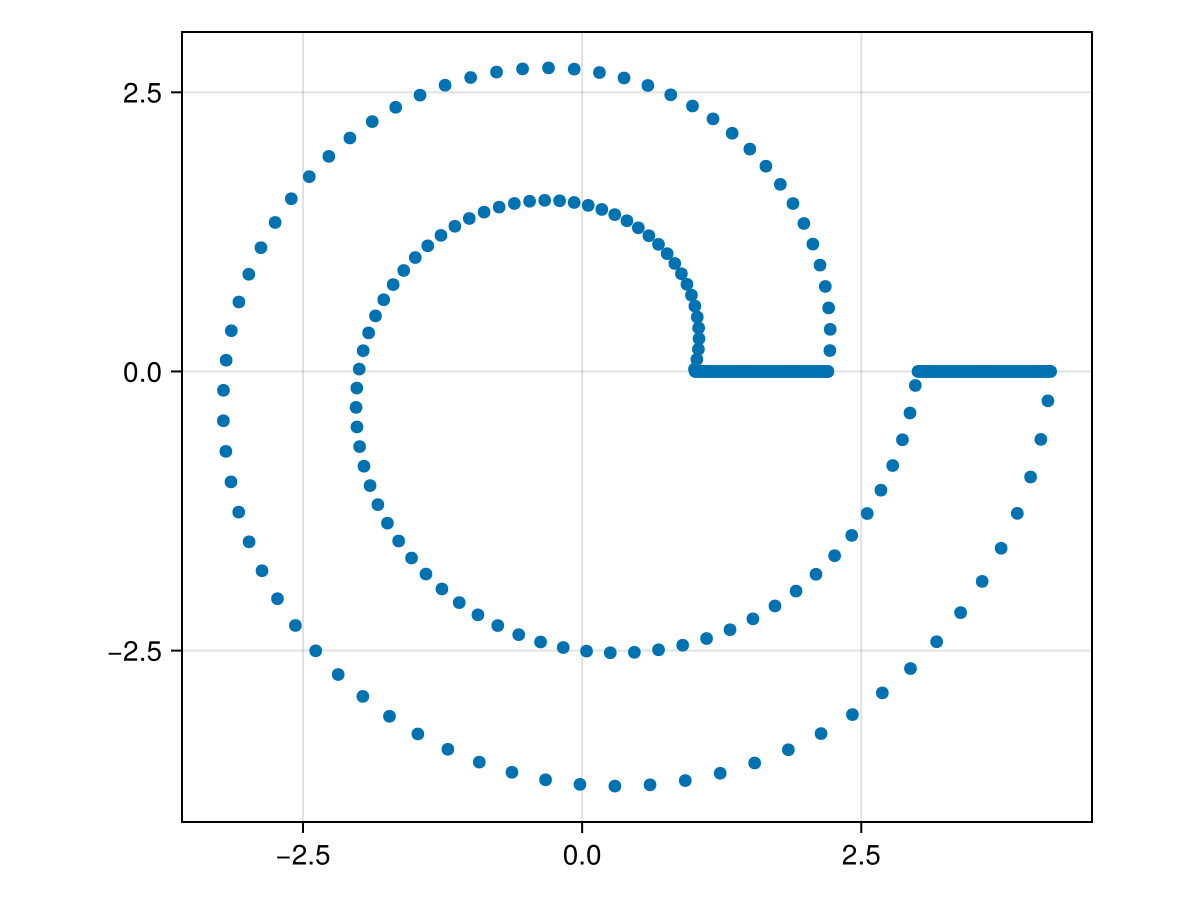
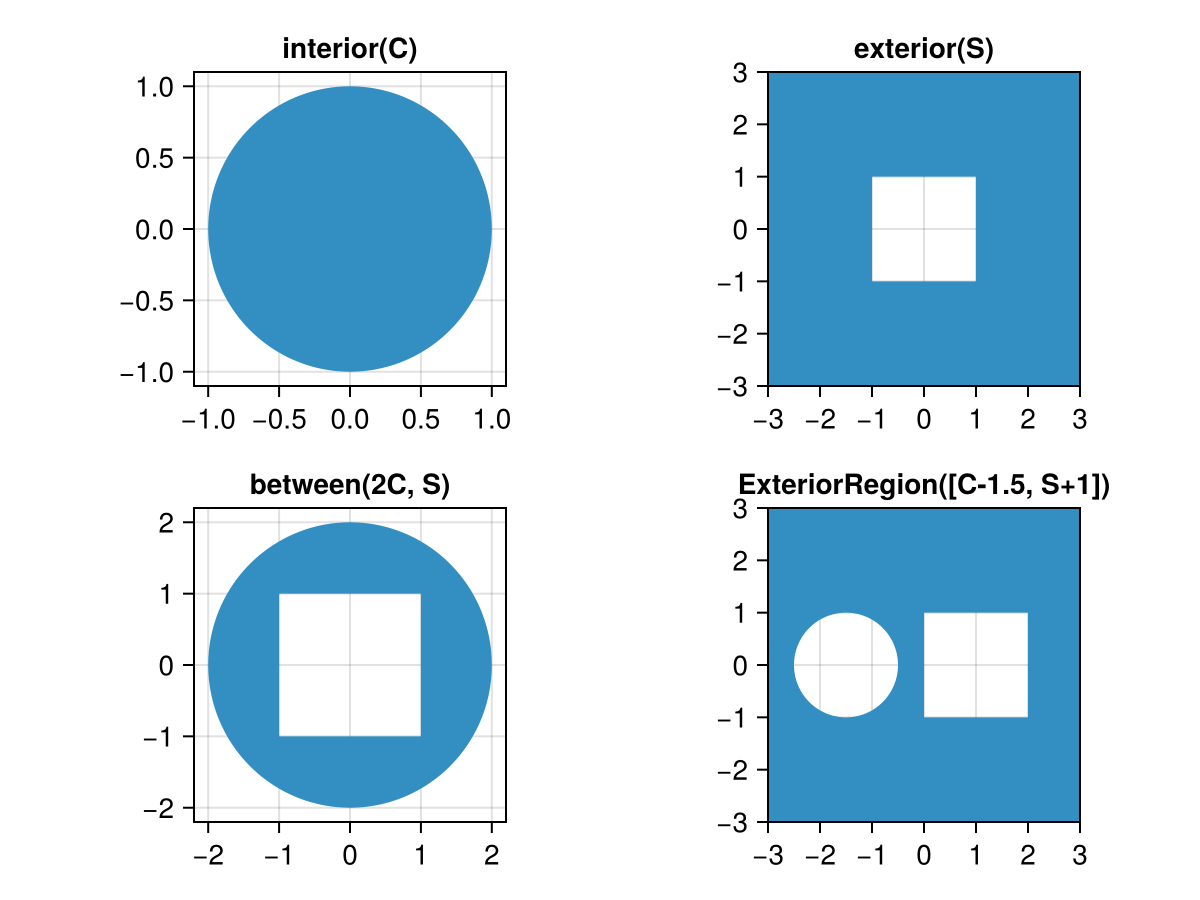
Regions
Regions are rendered as Poly objects, which have fill colors.
C = Circle(0, 1);  S = Shapes.square;
cmds = [ "interior(C)" "exterior(S)"; "between(2C, S)" "ExteriorRegion([C-1.5, S+1])" ]
fig = Figure()
for i in 1:2, j in 1:2
    ax = Axis(fig[i, j], title=cmds[i, j])
    Meta.parse("poly!($(cmds[i, j]))") |> eval
    if j == 2
        ax.limits = (-3, 3, -3, 3)
    end
end
fig